Investing in small apartment buildings calls for a strategic approach grounded in understanding key metrics.
These metrics provide valuable insights that enable investors to navigate complexities effectively.
By focusing on these indicators, we can make informed decisions that align with financial goals.

Our ability to interpret these metrics directly influences the success of our investments. With an informed perspective, we can anticipate challenges, maximize returns, and ensure a balanced portfolio.
As we delve into this topic, our goal is to shed light on the essential metrics that contribute to successful real estate ventures.
1) Net Operating Income (NOI)
Net Operating Income (NOI) is a crucial metric when evaluating the financial performance of small apartment buildings.
It represents the income generated after deducting operating expenses.
This figure gives us insight into a property’s profitability potential, making it an essential metric for investors.
To calculate NOI, we subtract the property’s operating expenses from its gross income.
Operating expenses typically include costs like maintenance, insurance, property management fees, and utilities.
However, mortgage payments and capital expenditures are not part of this calculation.
NOI serves as a helpful tool in comparing different investment properties.
By providing a straightforward measure of operating profitability, it allows us to make informed decisions about potential acquisitions.
A higher NOI indicates a more profitable property, assuming other factors such as location and market conditions also align.
This metric also serves another purpose: it is used in the calculation of the capitalization rate (cap rate), which helps determine a property’s valuation.
Understanding these figures can significantly improve our ability to assess investment opportunities in the real estate market.
By honing in on the NOI, we’re better equipped to analyze and select properties that meet our financial goals.
2) Capitalization Rate (Cap Rate)
The capitalization rate, commonly referred to as the cap rate, is a vital metric in real estate investment analysis.
It measures the expected return on a property by comparing the net operating income (NOI) to the property’s market value.
This percentage helps us assess the potential profitability of a small apartment building.
To calculate the cap rate, we divide the net operating income by the current value of the property.
For example, if an apartment building has a net operating income of $90,480 and a market value of $1,200,000, the cap rate would be approximately 7.54%.
This rate provides a snapshot of potential returns.
The cap rate can be instrumental in comparing properties within the same market.
A higher cap rate typically signals a higher risk and potentially higher return, while a lower cap rate might indicate a more stable investment.
It’s crucial that we consider the cap rate in the context of our risk tolerance and investment strategy.
When assessing various properties, it’s important to use the cap rate alongside other metrics.
It offers insight into profitability but doesn’t account for factors like market trends or property condition.
3) Cash Flow
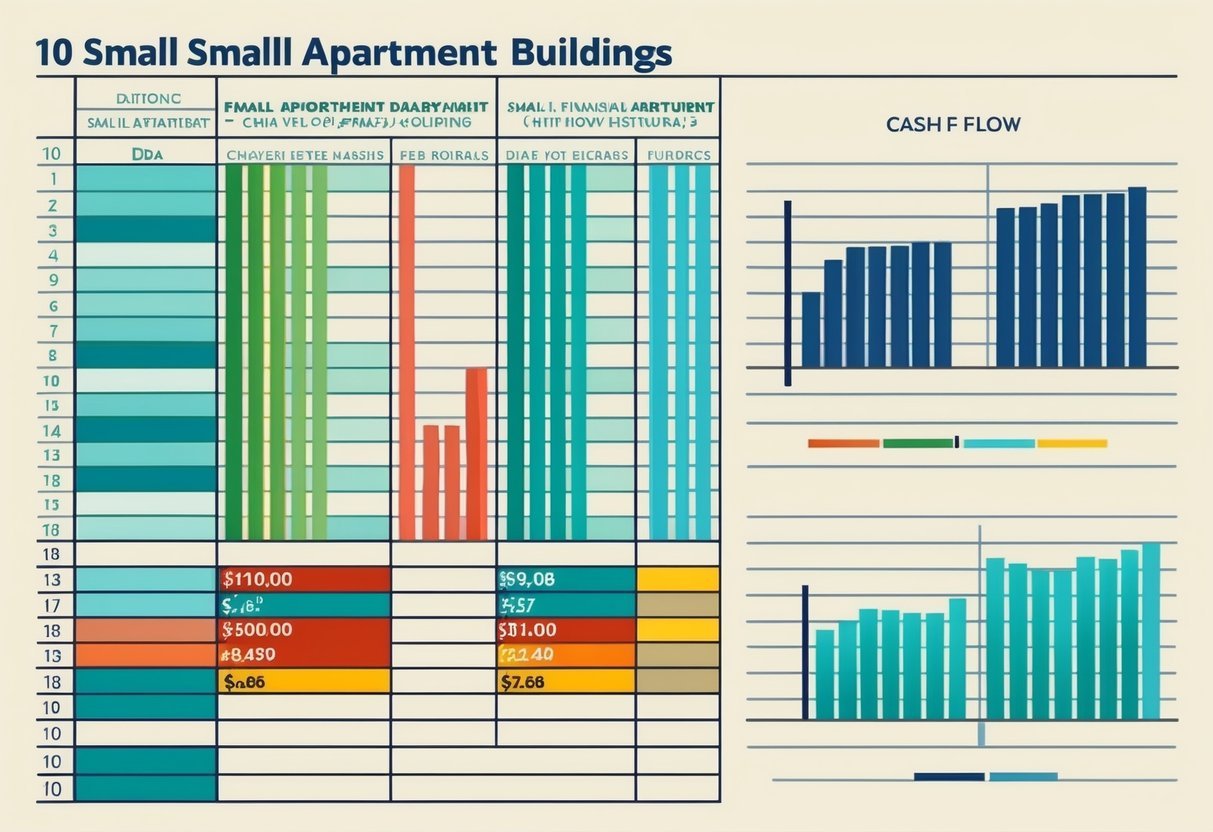
Cash flow is a critical metric for evaluating the profitability of investing in small apartment buildings.
It helps us understand how much money remains after all expenses have been paid.
Positive cash flow indicates that the property generates more money than it costs, which is a good sign of financial health.
To calculate cash flow, we subtract operating expenses and mortgage payments from the rental income.
This simple formula allows us to assess whether a property can cover its costs and provide a return on investment.
It’s essential to account for all costs, including maintenance, taxes, and insurance, to get an accurate figure.
A consistent positive cash flow can contribute to the stability of our investment portfolio.
It can help us cushion against unexpected expenses, reinvest in property improvements, or even expand our investment holdings.
Tracking cash flow regularly also aids in making informed decisions that align with our financial goals.
It’s important to differentiate between gross and net cash flow.
Gross cash flow refers to total revenue before expenses, while net cash flow reflects funds available after all expenditures are settled.
Understanding this distinction allows us to analyze the property’s true performance better.
4) Occupancy Rate

When we assess small apartment building investments, one crucial metric is the occupancy rate.
This figure tells us what percentage of the available units are currently rented out compared to the total number of units.
A high occupancy rate generally indicates strong demand and suggests that the property is attracting and retaining tenants effectively.
Monitoring the occupancy rate helps us identify market trends and potential risks.
Fluctuations in this rate could point to changes in local rental demand or issues with the property itself.
A sudden drop might signal economic difficulties in the area or a need for property improvements.
Furthermore, an ideal occupancy rate is often property-specific and varies with market conditions.
While 100% occupancy might initially seem desirable, it might also imply that rent prices are too low.
Conversely, too low a rate could mean prices are too high or tenant dissatisfaction.
By analyzing occupancy rate trends, we can make informed decisions about pricing strategies and marketing efforts.
Adjusting rental rates accordingly can help optimize income without risking tenant turnover.
Maintaining a balance ensures we maximize profitability while keeping vacancy periods short.
Occupancy rates also provide insights into property management efficiency.
Regular maintenance and prompt responses to tenant requests can positively influence the rate.
Therefore, our approach to managing tenant relationships is vital in maintaining a desirable occupancy level.
5) Internal Rate of Return (IRR)

When evaluating investment opportunities in small apartment buildings, the Internal Rate of Return (IRR) is a crucial metric.
It helps us understand the annualized rate of return an investment is expected to generate.
By using IRR, we can assess the efficiency of an investment in comparison to others.
IRR is calculated by identifying the discount rate that makes the net present value (NPV) of all cash flows from the investment equal to zero.
This allows us to determine the rate at which an investment breaks even in terms of the present value of its net cash inflows and outflows.
Using IRR, we can compare different investment opportunities on a level playing field.
It accounts for the time value of money, ensuring that we consider when the cash flows occur.
This makes it easier for us to prioritize investments that offer a higher return potential within a given period.
In the context of small apartment buildings, IRR is essential for projecting cash flow performance.
It gives us a clear picture of how well an investment aligns with our financial goals.
By comparing IRR to our cost of capital, we can make informed decisions about which properties are worth pursuing.
6) Gross Rent Multiplier (GRM)
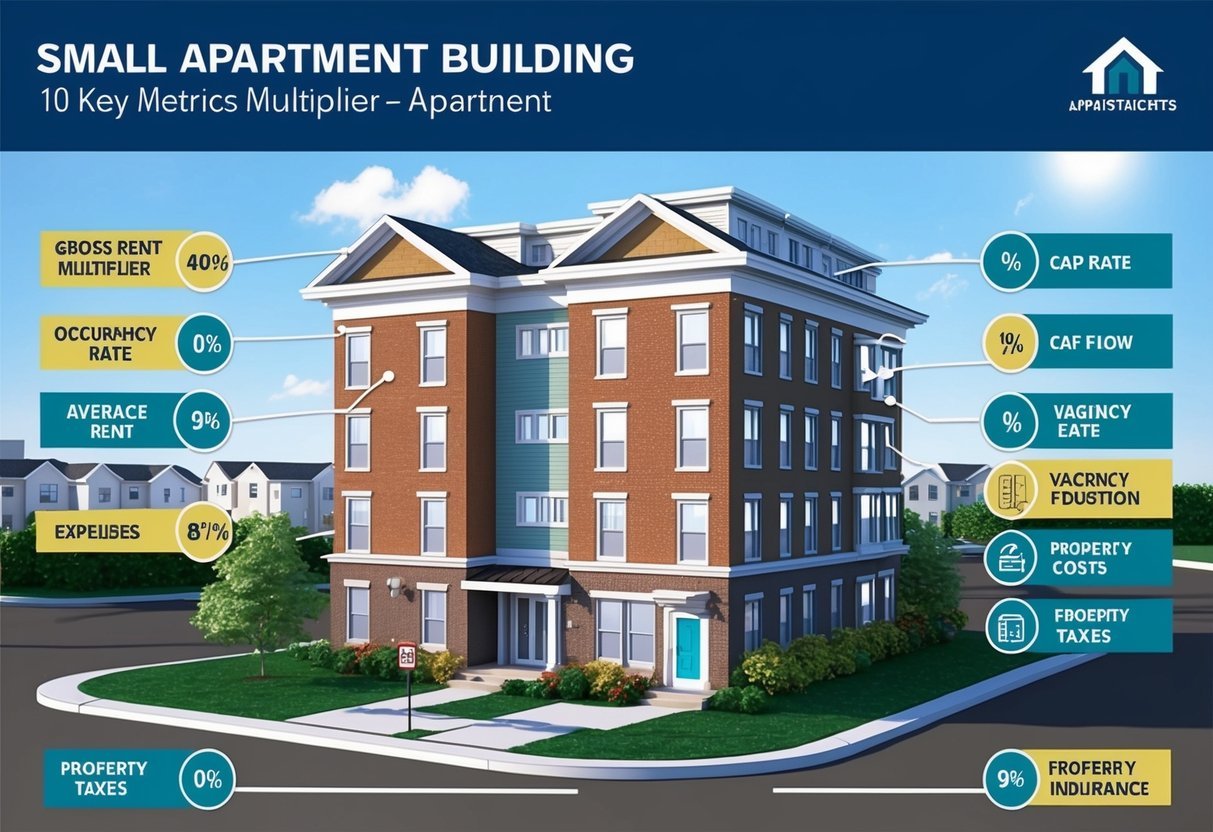
When evaluating investment properties, the Gross Rent Multiplier (GRM) stands out as a straightforward metric.
It allows us to assess the value of a property in relation to its rental income.
This figure helps us quickly compare the potential of different properties without diving into more complex financial assessments.
To calculate the GRM, we divide the property’s fair market value by its gross rental income.
For example, if a building is valued at $1,000,000 and generates $100,000 in annual rent, the GRM would be 10.
This ratio provides an immediate sense of how long it might take for rental income to cover the purchase price, assuming stable income.
A lower GRM often indicates a potentially better investment, since it implies a shorter time to recoup the property’s cost.
However, while this metric is useful, it’s crucial for us to also consider other factors such as location, operational costs, and market conditions.
Comparing GRMs across similar properties helps us identify outliers and potentially lucrative opportunities.
It’s important to remember that relying solely on GRM might not capture the full picture.
Still, it’s a valuable tool in our real estate analysis toolkit.
7) Operating Expense Ratio (OER)
The Operating Expense Ratio (OER) is a crucial metric for assessing the efficiency of managing small apartment buildings.
It represents the proportion of operating expenses to the gross income generated by the property.
By calculating OER, we can gauge whether the property’s operational costs are in line with its income.
A lower OER is typically desirable, as it indicates lower operating expenses relative to income, suggesting efficient management.
Conversely, a high OER might signal increased operational costs or inefficiencies that could impact profitability.
Monitoring this ratio helps us make informed decisions about potential investments and management practices.
It’s essential that we regularly review the OER to track changes in efficiency over time.
An increase in the ratio might suggest that rental income is not keeping pace with rising expenses, prompting a need to reassess both rent levels and expense management strategies.
Investors often compare the OER of different properties to identify which ones are managed more efficiently.
By doing so, we can better understand which properties might yield better returns over time.
This metric becomes a vital tool in evaluating an investment’s performance potential.
Gaining a clear picture of the operating expenses includes assessing costs such as maintenance, utilities, property management fees, and insurance.
Accurate and consistent record-keeping is essential to ensure that the OER reflects true property performance.
8) Debt Service Coverage Ratio (DSCR)
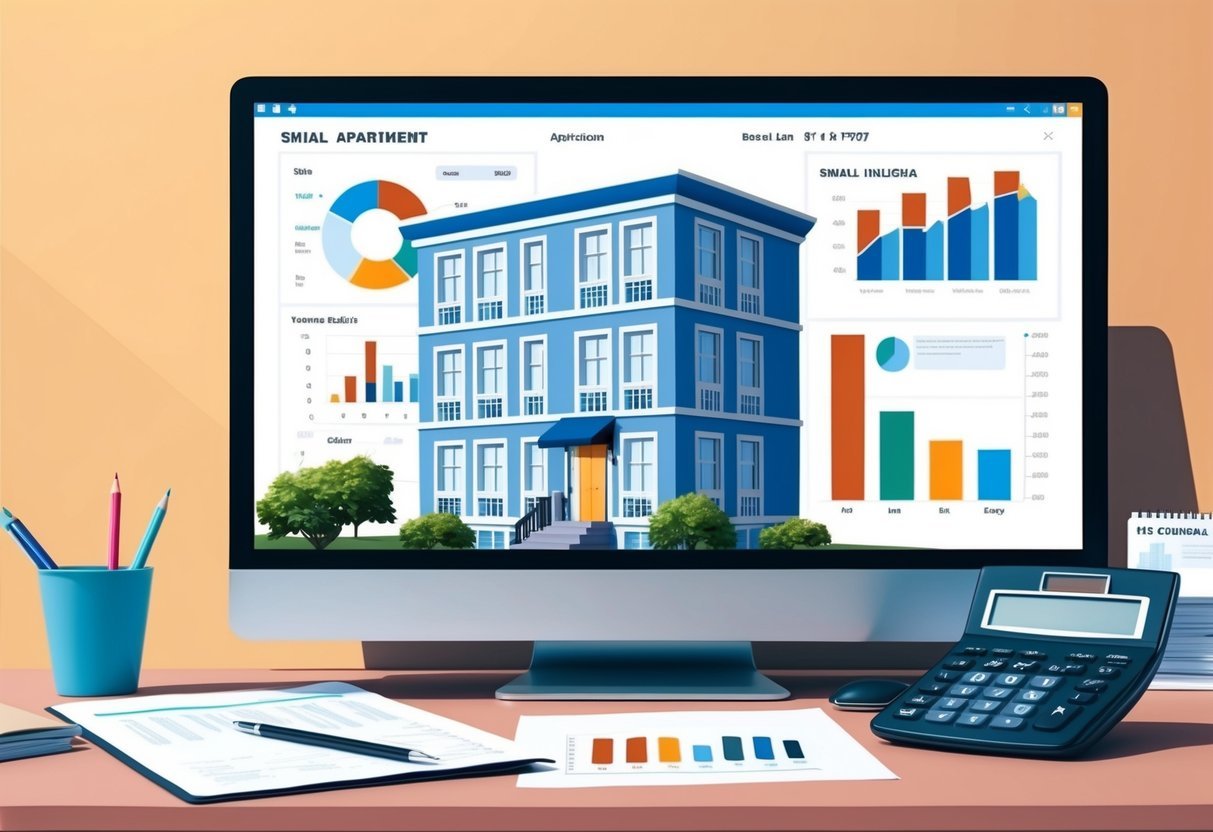
The Debt Service Coverage Ratio (DSCR) is essential in assessing the financial health of small apartment buildings.
It measures the property’s ability to cover its debt obligations with its net operating income.
A higher ratio indicates a stronger capacity to service debt, which offers peace of mind to lenders and investors alike.
When we calculate DSCR, we start by determining the net operating income (NOI).
This figure is obtained by subtracting certain operating expenses from revenue.
Next, we identify the total debt service, which includes both principal and interest payments on loans.
Dividing the NOI by the total debt service gives us the DSCR.
A DSCR of 1.0 or above is generally seen as favorable, as it means the income generated by the building is sufficient to meet debt obligations.
Ratios higher than 1.25 are often preferred, suggesting greater financial resilience and a lower risk of default.
Investors should strive for these figures to ensure stable returns on their investments.
9) Loan-to-Value Ratio (LTV)

The Loan-to-Value (LTV) ratio is an essential metric in real estate investment, especially when assessing small apartment buildings.
It compares the loan amount to the appraised value or purchase price of the property, whichever is less.
We calculate the LTV by dividing the loan amount by the appraised property value and expressing it as a percentage.
For instance, if we have a loan of $150,000 and a property appraised at $200,000, the LTV would be 75%.
A lower LTV ratio usually indicates less risk for lenders.
They prefer this as it suggests that we have a greater equity stake in the property.
This can lead to more favorable loan terms, like lower interest rates or reduced insurance requirements.
On the flip side, higher LTV ratios may pose increased risk.
When we encounter an LTV ratio above a lender’s comfort level, it might result in the need for private mortgage insurance or unfavorable loan conditions.
LTV ratios help us assess potential financing options.
Monitoring this metric ensures we’re making informed decisions about leveraging our equity.
Balancing a favorable LTV ratio while securing competitive loan terms can significantly impact our investment’s success.
10) Expense Ratios

Expense ratios are a crucial component in our analysis of small apartment buildings.
They help us assess whether a property is being managed efficiently by comparing total operating expenses to gross income.
By examining these ratios, we can identify if there are areas for potential cost savings or if the property is incurring excessive expenses.
A typical rule of thumb is that expenses often range from 30% to 50% of the gross income.
We find it essential to evaluate both fixed and variable costs when calculating expense ratios.
This includes costs like property management fees, insurance, maintenance, and utilities.
When we’re looking at expense ratios, it’s important for us to consider the property’s age, location, and size.
Older properties may have higher maintenance costs, while those in certain locations might face different utility expenses.
Each of these factors plays a role in our analysis.
In some cases, comparing the property’s expense ratio with similar buildings in the area gives us insights into its competitiveness.
Additionally, we must remain cautious of properties with unusually high or low ratios, as they may signal underlying issues.
Expense ratios also factor into our cash flow projections.
By accurately estimating and managing expenses, we ensure that we can maintain healthy profitability.
This helps us in making informed decisions about property investments and management strategies.
Understanding Key Investment Metrics
When investing in small apartment buildings, a good grasp of metrics like Net Operating Income, Capitalization Rate, and Cash-on-Cash Return is essential.
These will offer insights into financial performance, potential returns, and investment suitability.
Net Operating Income (NOI)
Net Operating Income (NOI) reflects the profitability of an income-producing property.
It is calculated by subtracting operational costs, such as property management fees, repairs, and utilities, from the total rental income.
By evaluating the NOI, we can assess how well a property generates revenue compared to its operating expenses.
This figure helps us determine a property’s intrinsic value and guides decision-making.
An increasing NOI over time suggests effective property management.
This improves our ability to project future earnings.
Comparing NOI across similar property investments allows us to identify the more profitable opportunities.
Capitalization Rate (Cap Rate)
The Capitalization Rate (Cap Rate) measures the expected return on investment from a property, expressed as a percentage.
It is calculated by dividing NOI by the property’s current market value.
Cap Rate provides a snapshot of risk and potential returns, guiding our investment choices.
A higher Cap Rate often indicates a riskier investment, while a lower Cap Rate suggests a more stable option.
This metric assists in comparing properties across different locations and market conditions.
Cap Rate allows us to evaluate the attractiveness of our investment relative to others.
Cash-on-Cash Return
Cash-on-Cash Return is a critical metric that measures the annual pre-tax cash flow relative to the amount of cash invested.
It is calculated using the formula: Annual Cash Flow / Total Cash Invested.
This metric helps us in understanding the profitability of a property relative to the cash used for the down payment and other initial expenses.
It provides a clearer picture of actual returns from a cash perspective.
By evaluating this measurement, we can gauge how effectively a property is generating cash returns on our initial investment.
This insight aids us in determining which investment opportunities are likely to yield the best financial outcomes for us.
Evaluating Profitability and Growth
In our analysis of small apartment buildings, understanding key metrics like Internal Rate of Return (IRR), Gross Rent Multiplier (GRM), and Operating Expense Ratio can help us assess profitability and anticipate growth potential.
These metrics provide valuable insights into an investment’s earning capacity and operational efficiency.
Internal Rate of Return (IRR)
IRR is a critical metric that measures the long-term potential of an investment by calculating the annual growth rate it is expected to generate.
This helps us compare prospective projects to make informed decisions.
It reflects the profitability of an investment by considering cash flows over time.
When we calculate IRR, we can assess whether a property meets our financial goals or outperforms other investment opportunities.
A higher IRR indicates a more profitable investment, provided other risks are manageable.
IRR provides a comprehensive look at future earning power, taking into account all expected cash flows, including any sale proceeds.
By comparing IRRs across different investments, we gain a clearer picture of potential returns relative to market conditions.
This helps optimize our portfolio strategy, ensuring we invest in properties that align with our financial targets.
Gross Rent Multiplier (GRM)
The GRM is a simple valuation tool that helps us quickly assess a property’s market value compared to its rental income.
By dividing the property’s price by its gross annual rental income, we get an indicator of its investment potential.
GRM = Property Price / Gross Annual Rent
This metric is useful for comparative analysis across similar properties.
A lower GRM suggests a better investment opportunity as it indicates you’re paying less for each dollar of rent you earn.
We often utilize GRM alongside other metrics to validate our investment analysis.
While it doesn’t account for expenses or market fluctuations, it provides a quick snapshot of a property’s value based on current rental income.
This can guide us when making initial evaluations or considering competitive bids.
Operating Expense Ratio
The Operating Expense Ratio (OER) measures the cost efficiency of managing an apartment building.
It assesses what portion of income is consumed by operating expenses.
OER = Operating Expenses / Gross Operating Income
By focusing on this ratio, we gain insight into how well a property is managed and identify areas for improvement.
Lower ratios imply more efficient management and a greater proportion of income converted into profit.
Comparing this ratio across similar properties helps us determine expected expenses relative to income.
It allows us to pinpoint inefficiencies and strategize cost-cutting measures.
Through careful cost management, we enhance the investment’s growth potential and long-term profitability.
Risk Assessment Metrics
When investing in small apartment buildings, evaluating risk through financial metrics is crucial.
These assessments help us gauge potential financial exposure and ensure stable cash flow.
Loan-to-Value Ratio (LTV)
The Loan-to-Value Ratio (LTV) measures the amount of a loan relative to the value of the property purchased.
Calculating this involves dividing the loan amount by the property’s appraised value or purchase price.
For example, if a property is worth $500,000 and the loan is $400,000, the LTV ratio is 80%.
A lower LTV ratio indicates more equity in the property, reducing the investment’s risk profile.
This metric is critical for us as it influences lending decisions, interest rates, and our financing options.
Lenders typically prefer LTV ratios below 80% as it suggests lower risk.
This provides a cushion in case of property value fluctuations, offering us stability and better negotiation power with lenders.
Debt Service Coverage Ratio (DSCR)
The Debt Service Coverage Ratio (DSCR) reflects our ability to cover total debt service with net operating income.
It’s calculated by dividing the property’s annual net operating income by the total annual debt payments.
A
What is the significance of the cap rate in small apartment building investments?
The Cap Rate is significant because it helps us evaluate the rate of return expected from the building.
It serves as a quick reference point for assessing whether an investment aligns with our financial goals.
A higher Cap Rate typically indicates a higher potential return, considering other factors.
